
Well I’m accustomed to a smooth ride
Or maybe I’m a dog who’s lost it’sbite
I don’t expect to be treated like a fool no more
I don’t expect to sleep through the night
Some people say a lie’s a lie’s a lie
But I say why
Why deny the obvious child?
-Paul Simon, “Obvious Child”
The S&P 500[1] reached an all-time high of 4,793 on December 29, 2021. Soon after the market achieved this milestone, the Federal Reserve began their well-telegraphed program of raising interest rates. While the Fed attempted to end their Great Financial Crisis induced zero interest rate policy (ZIRP) in 2018, only to relinquish as markets deteriorated quickly, this time their hand was forced by the first serious inflation in 40 years.
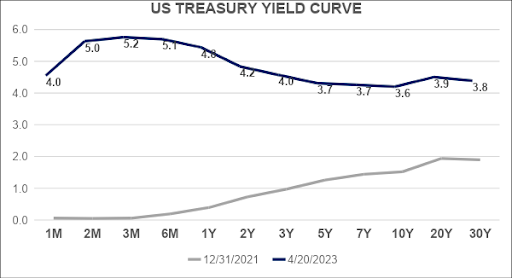
Source: US Treasury
The stock market fell as a result. At one point, the market was down by -25%. After a somewhat sustained market rally, the stock market closed -13% below its all-time high on 4/28/2023.
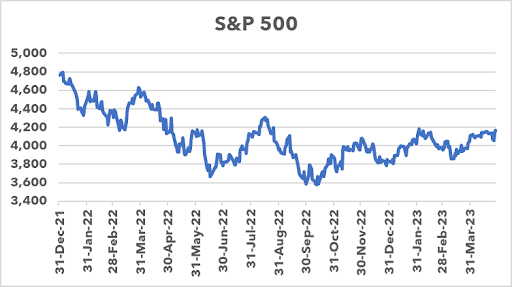
Source: S&P Global
After the Federal Reserve raised the Federal Funds rate from 0% at the end of 2021, to 5% today, Treasury Bills are the one asset class currently offering expected returns greater than their historical averages. While an investor in US-Treasury Bills historically earned 3.7% per year, today they can receive 5.2% for lending their money to the US Government for 3 months. The downward sloping yield curve is the bond market’s vote that the Fed has overdone it and the economy cannot stay healthy with a 5% risk-free rate. The 10-Year US Treasury yield sits at 3.4% compared to a historical average of 4.9%. Still below average, but materially better than the paltry 1.5% on 12/31/2021. That financial institutions like Silicon Valley Bank rushed in to earn 1.5% instead of waiting for 3.6% was a big reason why they went bust. They weren’t the only ones who grew impatient.
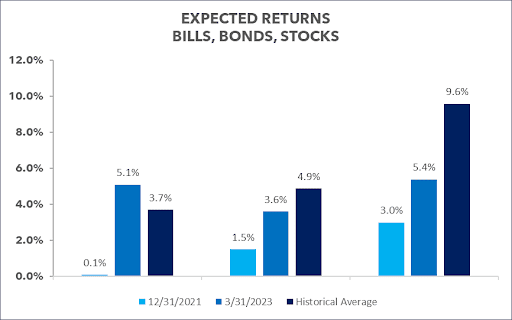
Source: “Triumph of the Optimists”, Dimson and Marsh; US Treasury; Vanguard
Similarly, expected returns in the stock market have improved markedly, but remain well below historical averages. After generating returns above historical averages for the past 7-to-10 years, the market stands poised to generate below average returns over the next decade.
There are two ways that 5.4% can get back to the historically observed 10% return. Firstly, earnings growth can simply outpace S&P 500 price appreciation to the point that the price on the market is eventually justified by the fundamentals. Or, the market can take a significant downturn to get much cheaper quickly. For example, if the S&P 500 fell by approximately -30% before the end of the year, the expected return would rise to the historical average. How likely is it that the market would fall by 30% versus slowly growing into its current, inflated price? The stock market fell by that much or more in the DotCom Crash of 2001; the Great Financial Crisis of 2008; and the Covid crash of 2020. The ending of 13 years of ZIRP seems equally momentous.
We don’t know for certain which path the market will take to start to offer higher returns. Or, even if it ever will. Butwe do know that the risk that it will fall by an unacceptable amount for our investors remains above average.
Investors maintaining half of their normal stock market exposure makes sense to us. Being able to generate 5% in US Treasuries with virtually no risk and almost no volatility is superior to us than attempting to earn the same in the stock market with much higher volatility.The stock market’s optimism disagrees with the pessimism of the bond market. We are inclined to believe the bond market. But we are not doctrinaires. We are open to the idea that the stock market is correct. Consequently, it makes sense to maintain some exposure to the stock market, especially when that exposure is governed by trend. Historically, trend following has done a good job of getting out of the market early during pronounced corrections.
It is historically unusual that you can receive the same expected returns in 3-month US Treasury Bills as you can in the S&P 500. We do not expect this situation to last for very long. Until then, it’s wise for investors to tread carefully. And demand greater returns for taking more risk.
[1] Standard and Poor’s 500 (S&P 500) is an index of the 500 largest U.S. public companies. It measures companies’ size by their market capitalization.